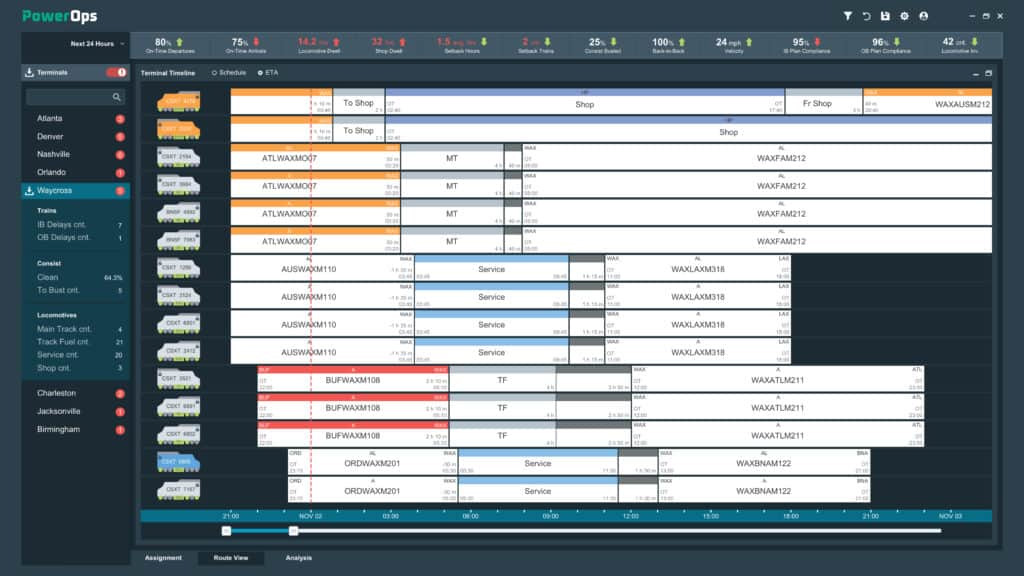
Visualization tools make life easier. Use PowerOps’ interactive locomotive graph to:
See where locomotives are and where they need to be.
Assign locomotives with drag-and-drop functionality.
Receive real-time updates about how decisions affect KPIs.
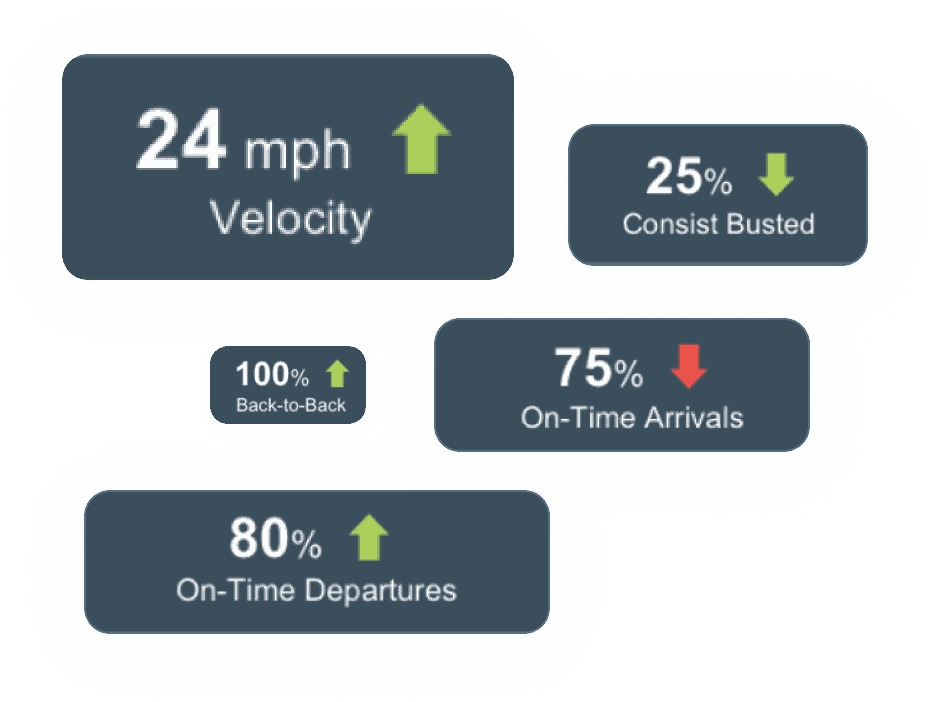
Measure what matters
Define your KPIs and track them using the PowerOps dashboard. Some key features to watch include:
Dwell time
In-service percentage
Utilization
Recover faster from disruptions
Don’t let the unexpected slow down your operations. Quickly find alternate locomotive availability and modify your network plan to adapt to changing conditions.
Increase productivity and reduce downtime
Increase asset utilization through better planning.
Reduce locomotive-caused delay and keep trains moving.
Reduce consist busting and direction changes.
Terminal assignments
Assign locomotives from inbound trains to outbound trains at each terminal.
Pipeline view
See how trains and locomotives will be moving within the network for a custom timeframe.
Custom reports
Create actionable reports to measure and improve operations.
Maintenance optimization
Task assignment based on real-time tracking of inbound asset locations.
Asset lifecycle planning
Right-size your fleet based on current needs and projections.
Workload balancing
Balance shop workloads in an intuitive drag-and-drop interface—or with the push of a button.
Ready to make better moves, faster?
Let’s talk about how Optym can help you outthink complexity, optimize decisions, and move your operation forward.