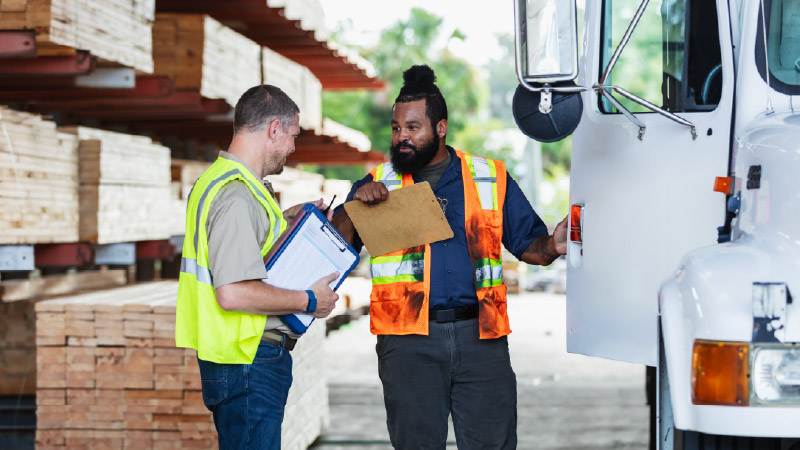
In final mile, performance conversations can get messy fast.
One team says the plan was efficient. Another says the field did everything it could. Leadership sees missed windows, late updates, and productivity numbers that do not quite line up.
So the debate begins.
- Was the plan unrealistic?
- Did execution break down?
- Were the numbers wrong?
- Did the dashboard miss what actually happened?
In many operations, the problem is that everyone is looking at a different version of the truth.
That is where final mile measurement has to mature.
The strongest operators do not just ask, “Did we hit the plan?” They ask, “Which version of the plan are we measuring against?”
The three versions of truth in final mile
Most final mile networks operate with three performance realities at the same time.
The Performance Truth Triangle
The simplest way to think about this is as a triangle:
Planned. Actual. Reported.
Each point tells part of the performance story. And when these three versions line up, leaders get a clear view of performance. When they do not, teams end up debating the numbers instead of improving the operation.
That is why the real insight often sits in the gaps.

Why the gaps happen
These gaps usually do not come from one big failure. They come from small disconnects throughout the day.
- A dispatcher edits a route, but the reason is not captured.
- A driver updates a stop after the fact.
- A customer reschedules, but the exception is handled locally.
- A route changes, but the dashboard still compares execution against the original plan.
- A delay is solved over the phone, but never coded in the system.
None of this is unusual in final mile. It is how teams keep the day moving. But when those changes are not reflected in the data, performance becomes hard to trust.
What leaders should track
Final mile leaders do not need hundreds of metrics. They need a practical set that connects planning, execution, and reporting.
1. On-time windows and service compliance
Do not just track whether a delivery was on time. Track why it was or was not.
Was the issue caused by the plan, the field, the customer, or the reporting flow?
That context turns service performance from a scoreboard into a learning system.
2. Route productivity proxies
Stops per trip, utilization, route density, miles, drive time, and crew usage all matter.
But they should be viewed with context.
A route can look productive on paper and still fail in the field. Another route may have fewer stops but protect high-value service commitments.
The goal is not simply to build fuller routes. It is to build routes that are productive, executable, and impact the bottom line.
3. Planning team productivity
Leaders should also understand how much effort it takes to create and maintain the plan.
- How much time is spent editing routes?
- How often do planners override the system?
- How many changes happen after the plan is released?
When the system handles more standard planning work, teams can spend less time fixing the plan and more time managing the exceptions that actually need human judgment.
4. Exception rate and exception resolution time
Exceptions show where the day breaks from plan.
Track how often they happen, but also how quickly they are detected, resolved, and communicated.
A high exception rate tells leaders where the operation is under pressure. Slow resolution time shows where visibility, process, or decision-making may need to improve.
The leadership takeaway
Final mile performance is only useful if leaders trust the measurement behind it.
That trust comes from connecting three views of the day:
- What was planned.
- What actually happened.
- What was reported.
When those views are aligned, leaders can stop debating the numbers and start improving the system. That is the next stage of final mile performance: not just better routing, but better decision-making.